Blog
-
Parsing Words with The Black Swan Method TM
Nine different verbalizations of one basic approach Proof of Life When there’s hundreds of counselors in the local area, why me? Why would you ever want to tell me anything at all about yourself? Command Tell me about yourself! Wrong Question Can you tell me about yourself? Yes Oriented Question Will you tell me about…
-
Zillow touring agreement promotes real estate agents to unpaid uber driver door opener prostitute
I’ve got bad news for the vast majority of you agents. Your agency owner or manager is going to authorize and encourage you to use this form, or something like it. They know it’s a million to one that you ever will figure out how to build a trusting relationship such that a client paid…
-
The Evolution of Real Estate Purchase Transactions

From prior to the existence of the National Association of Realtors and MLSs, through to the time of the Sitzer Burnett NAR lawsuit proposed settlement and Department of Justice involvement Pre-NAR Pre-MLS Simple Scenario No Agents Neither party has an agent. Pre-NAR Pre-MLS Agent Scenario Both parties might have an agent. circa 1994 NAR MLS…
-
You’re afraid it never will happen. You want home ownership to be attainable within your lifetime.
-
Disallow Collusion by Disallowing “Cooperative Compensation System” between agencies?
NAR Settlement with Sitzer-Burnett Seller Plaintiffs goes plenty far enough? It seems like this proposed settlement still allows for all the collusion hocus-pocus and fee overpricing to continue. Curious, what do you think about the most drastic, radical, solution being proffered? How about both NAR, and every one of the 50 state licensing boards, disallow…
-
Detroit Style Deep Dish Pizza with Martin’s Sourdough Focaccia Crust
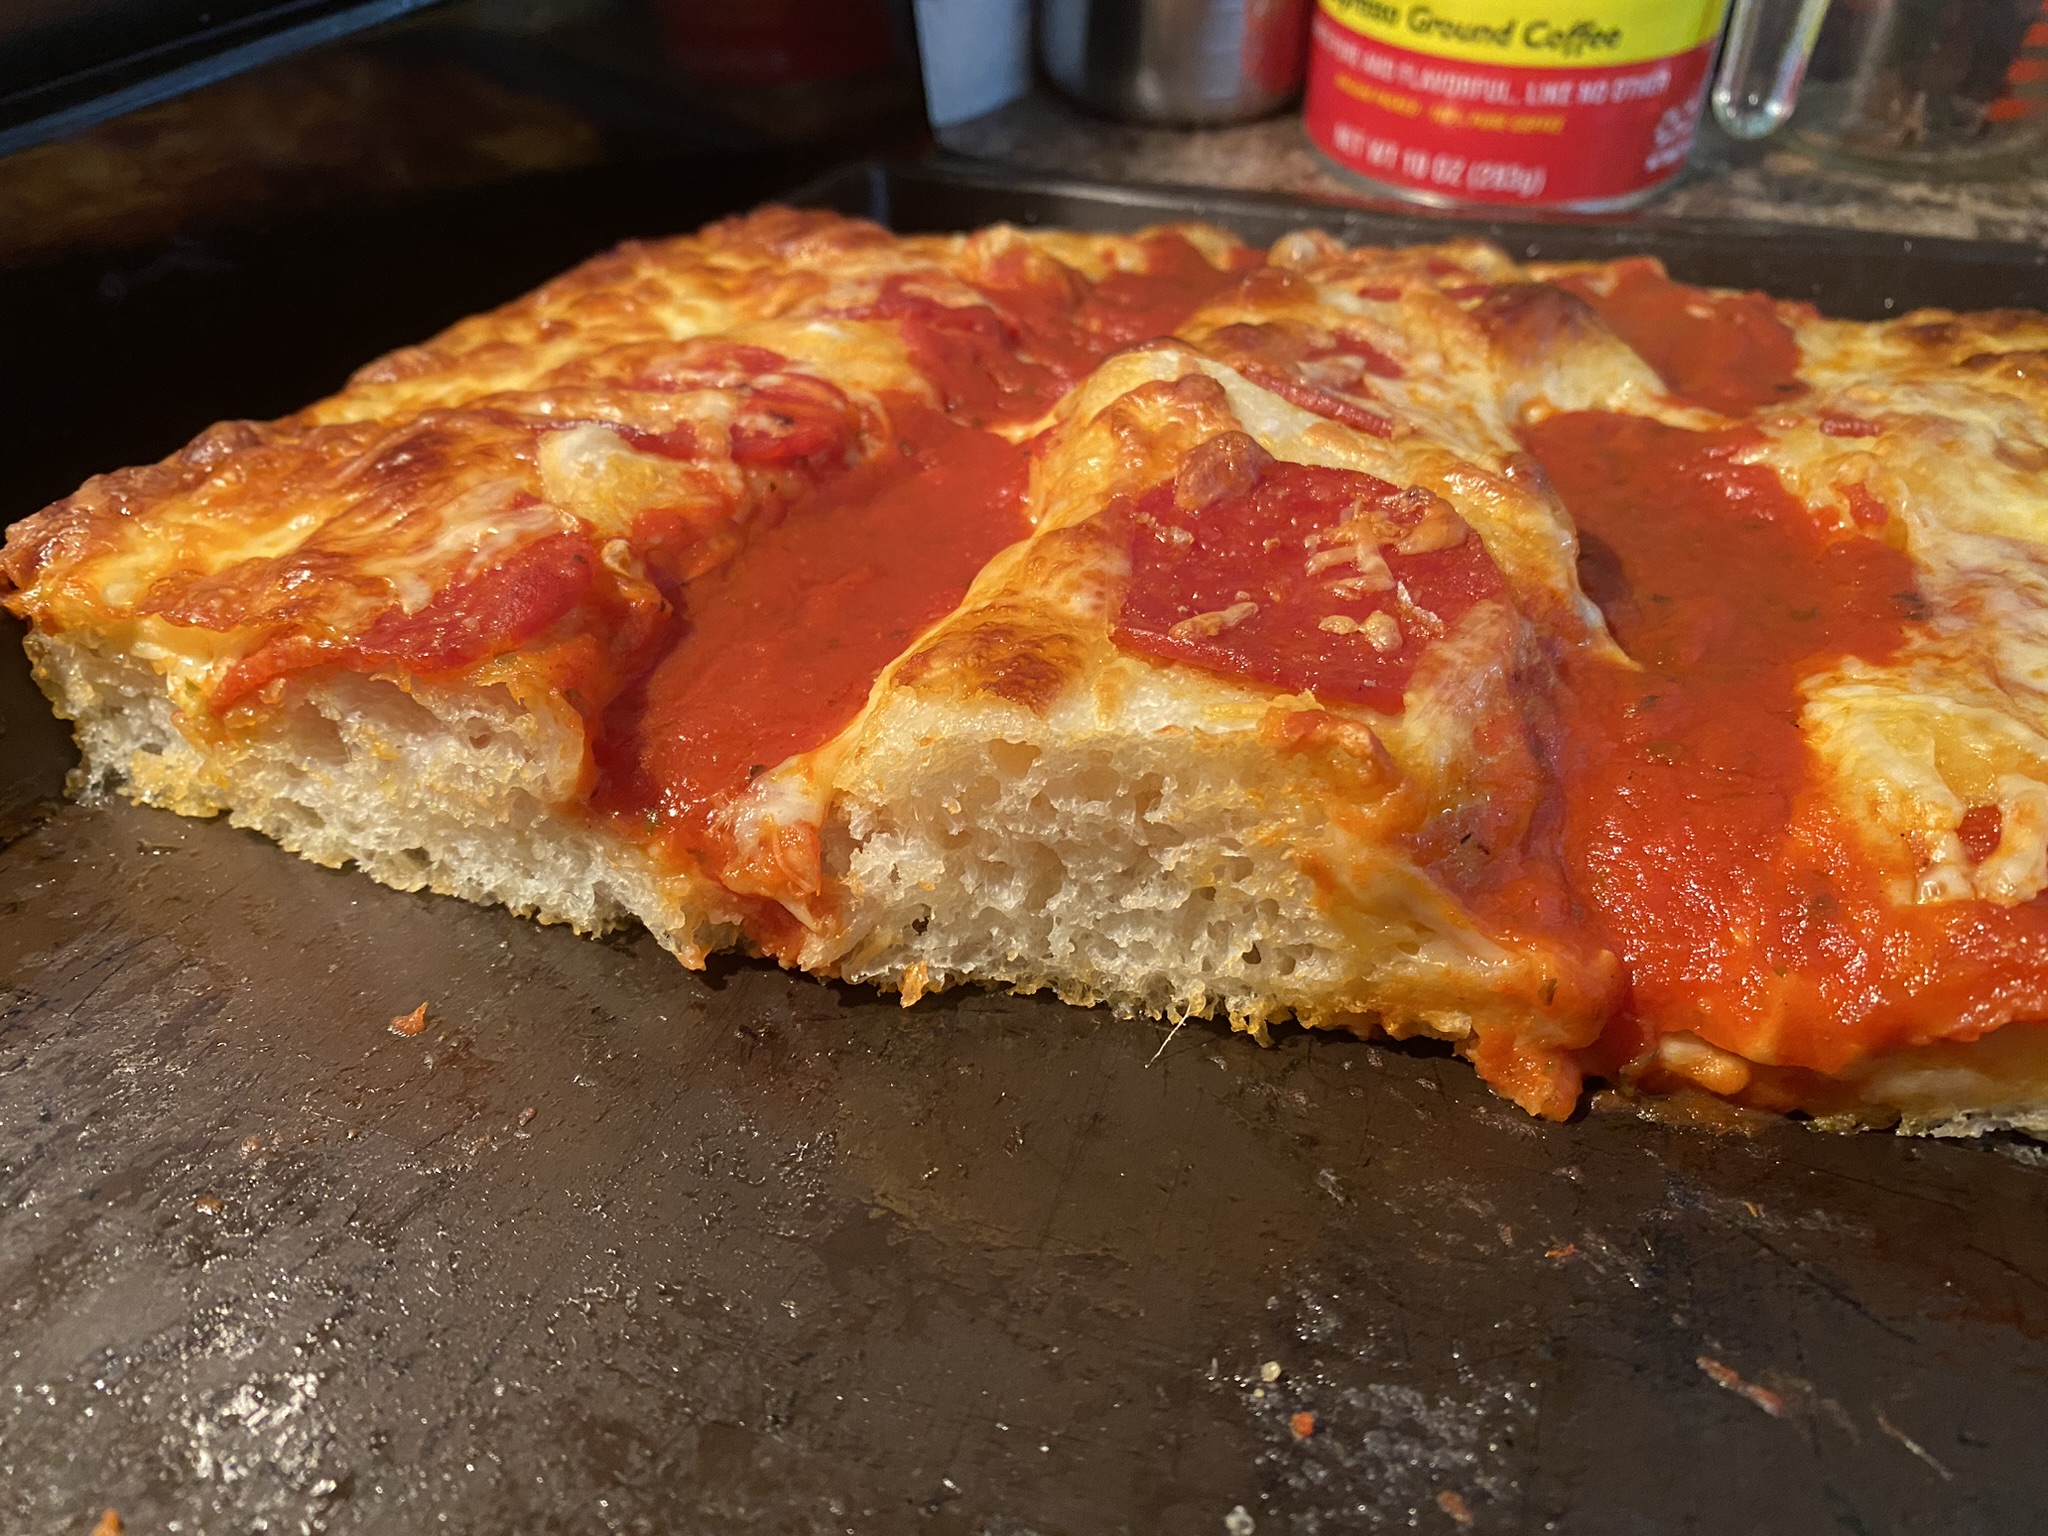
Charred cheese around the edges is the very best part. Pepperoni under the cheese keeps it not oily on top. Sauce on top keeps the crust not soggy.
-
131 Westside Drive, Forest City, NC 28043

New Construction Home Features Exquisite Artisan Tile Work For Sale 6 February 2024 via Realty Services by Martin Robbins
-
15-Minute Morning Stretching
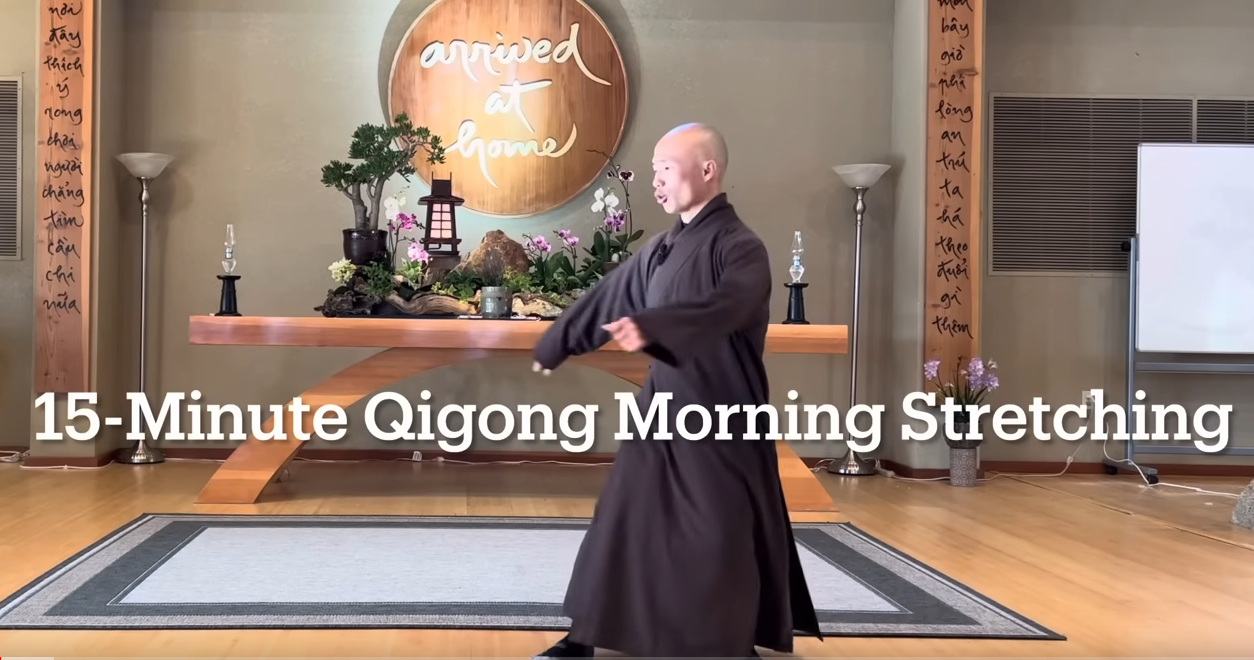
Qigong Daily Routine for Neck, Back, Shoulders
-
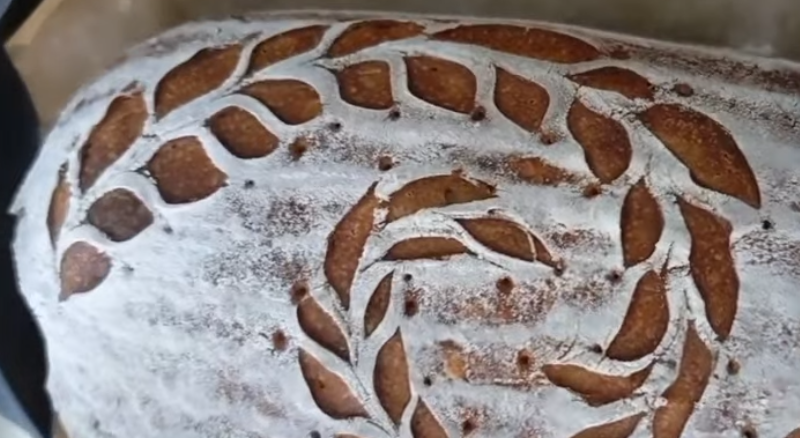
Sourdough Art